RECENT WORKaligning 8 product teams around a single North Star Metric
How can we create one North Star Metric framework to give eight disconnected product teams a shared focus, measurable outcomes and a clearer way to prioritise work?
Note: All metric names, values, and product identifiers have been redacted or abstracted in accordance with company confidentiality agreements.

Photo by Ricardo Rocha on Unsplash
the goal, my role and the result
Over 6 months, I led a cross-functional initiative with 5 designers, 1 researcher, POs, and data analysts. I designed the North Star Metric framework and led its rollout in design work.
The result:
a shared product focus
KPI dashboards, and standardised measurement across all teams
the challenge
Eight product teams were working in silos, each with their own goals and KPIs. Designers and researchers were spread thin across all 8 teams and there was no consistent way to measure impact or prioritise features.
This lack of clarity and transparency led to decisions that were inefficient and opaque.
process and approach
I started by mapping how each team measured success — many used output-focused KPIs (such as bounce rates, log ins, or monthly users) while others measured nothing at all, trusting gut feeling and qualitative user research to answer their questions.
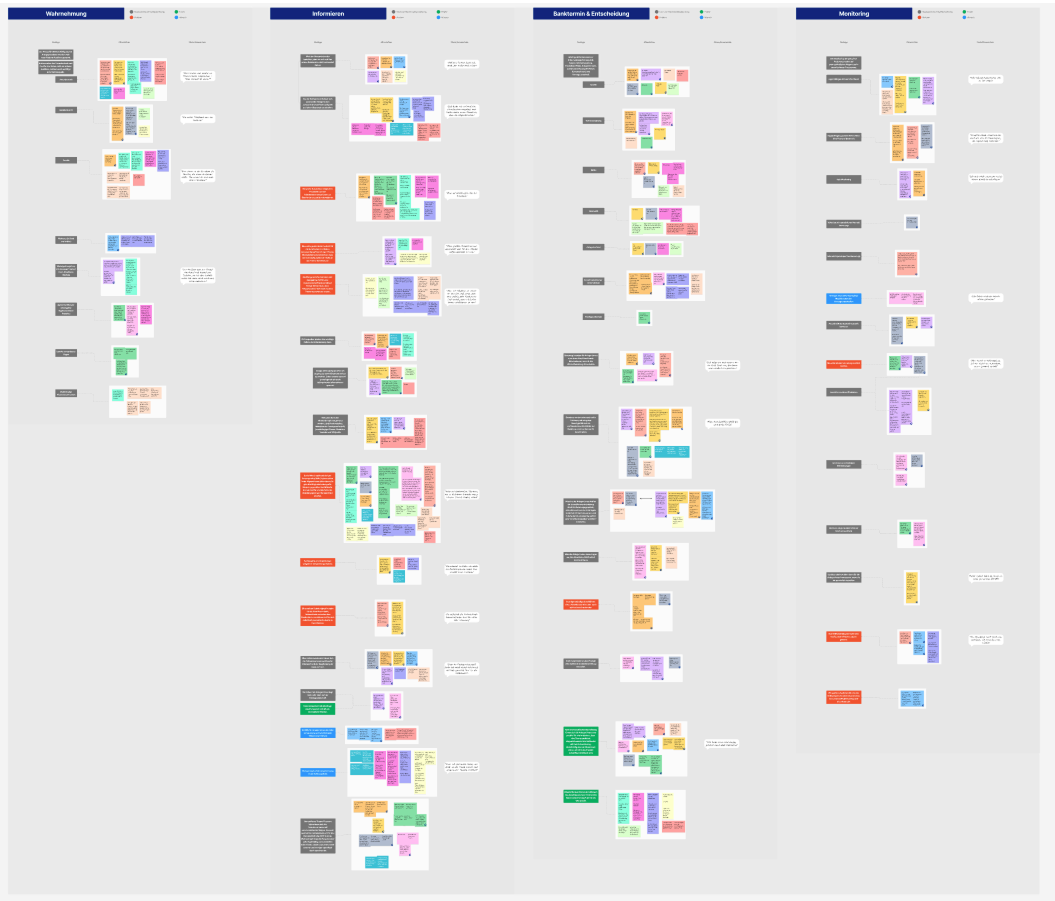
Overview of variety of attitudes towards KPI measurement across product teams.
Then I led workshops with Product, Engineering and Data leadership to define a single overarching metric representing long-term customer value, and a two-tiered model connecting business outcomes to team-level metrics. This allowed us to navigate on one metric while still giving each team the flexibility to set up their own North Stars as well.
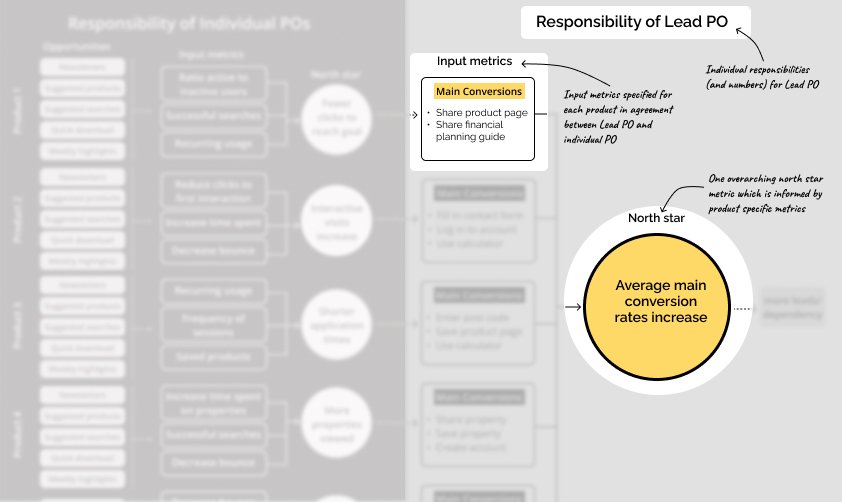
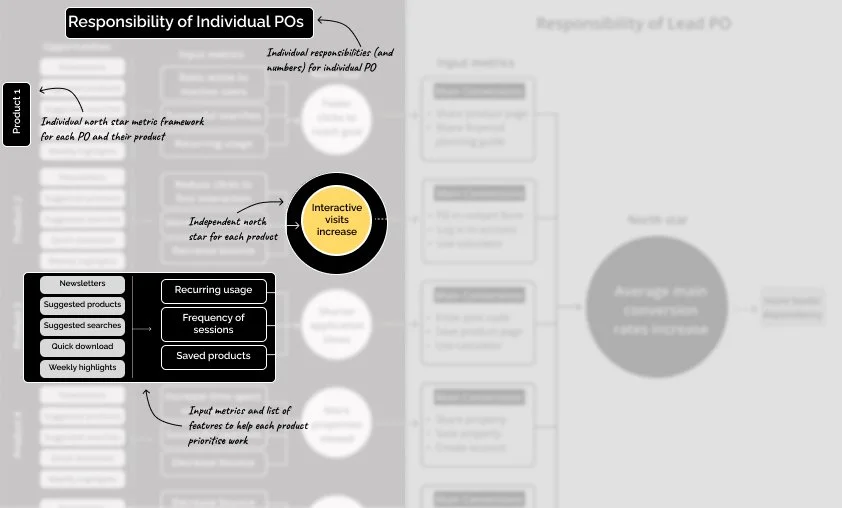
North Star Metric on overarching level, including its connection to North Stars of individual teams.
We piloted the framework, validated it, and scaled it across all teams within two quarters. Along the way, I embedded the NSM in design work, dashboards, and prioritisation processes so teams could see the impact of their decisions in real time.
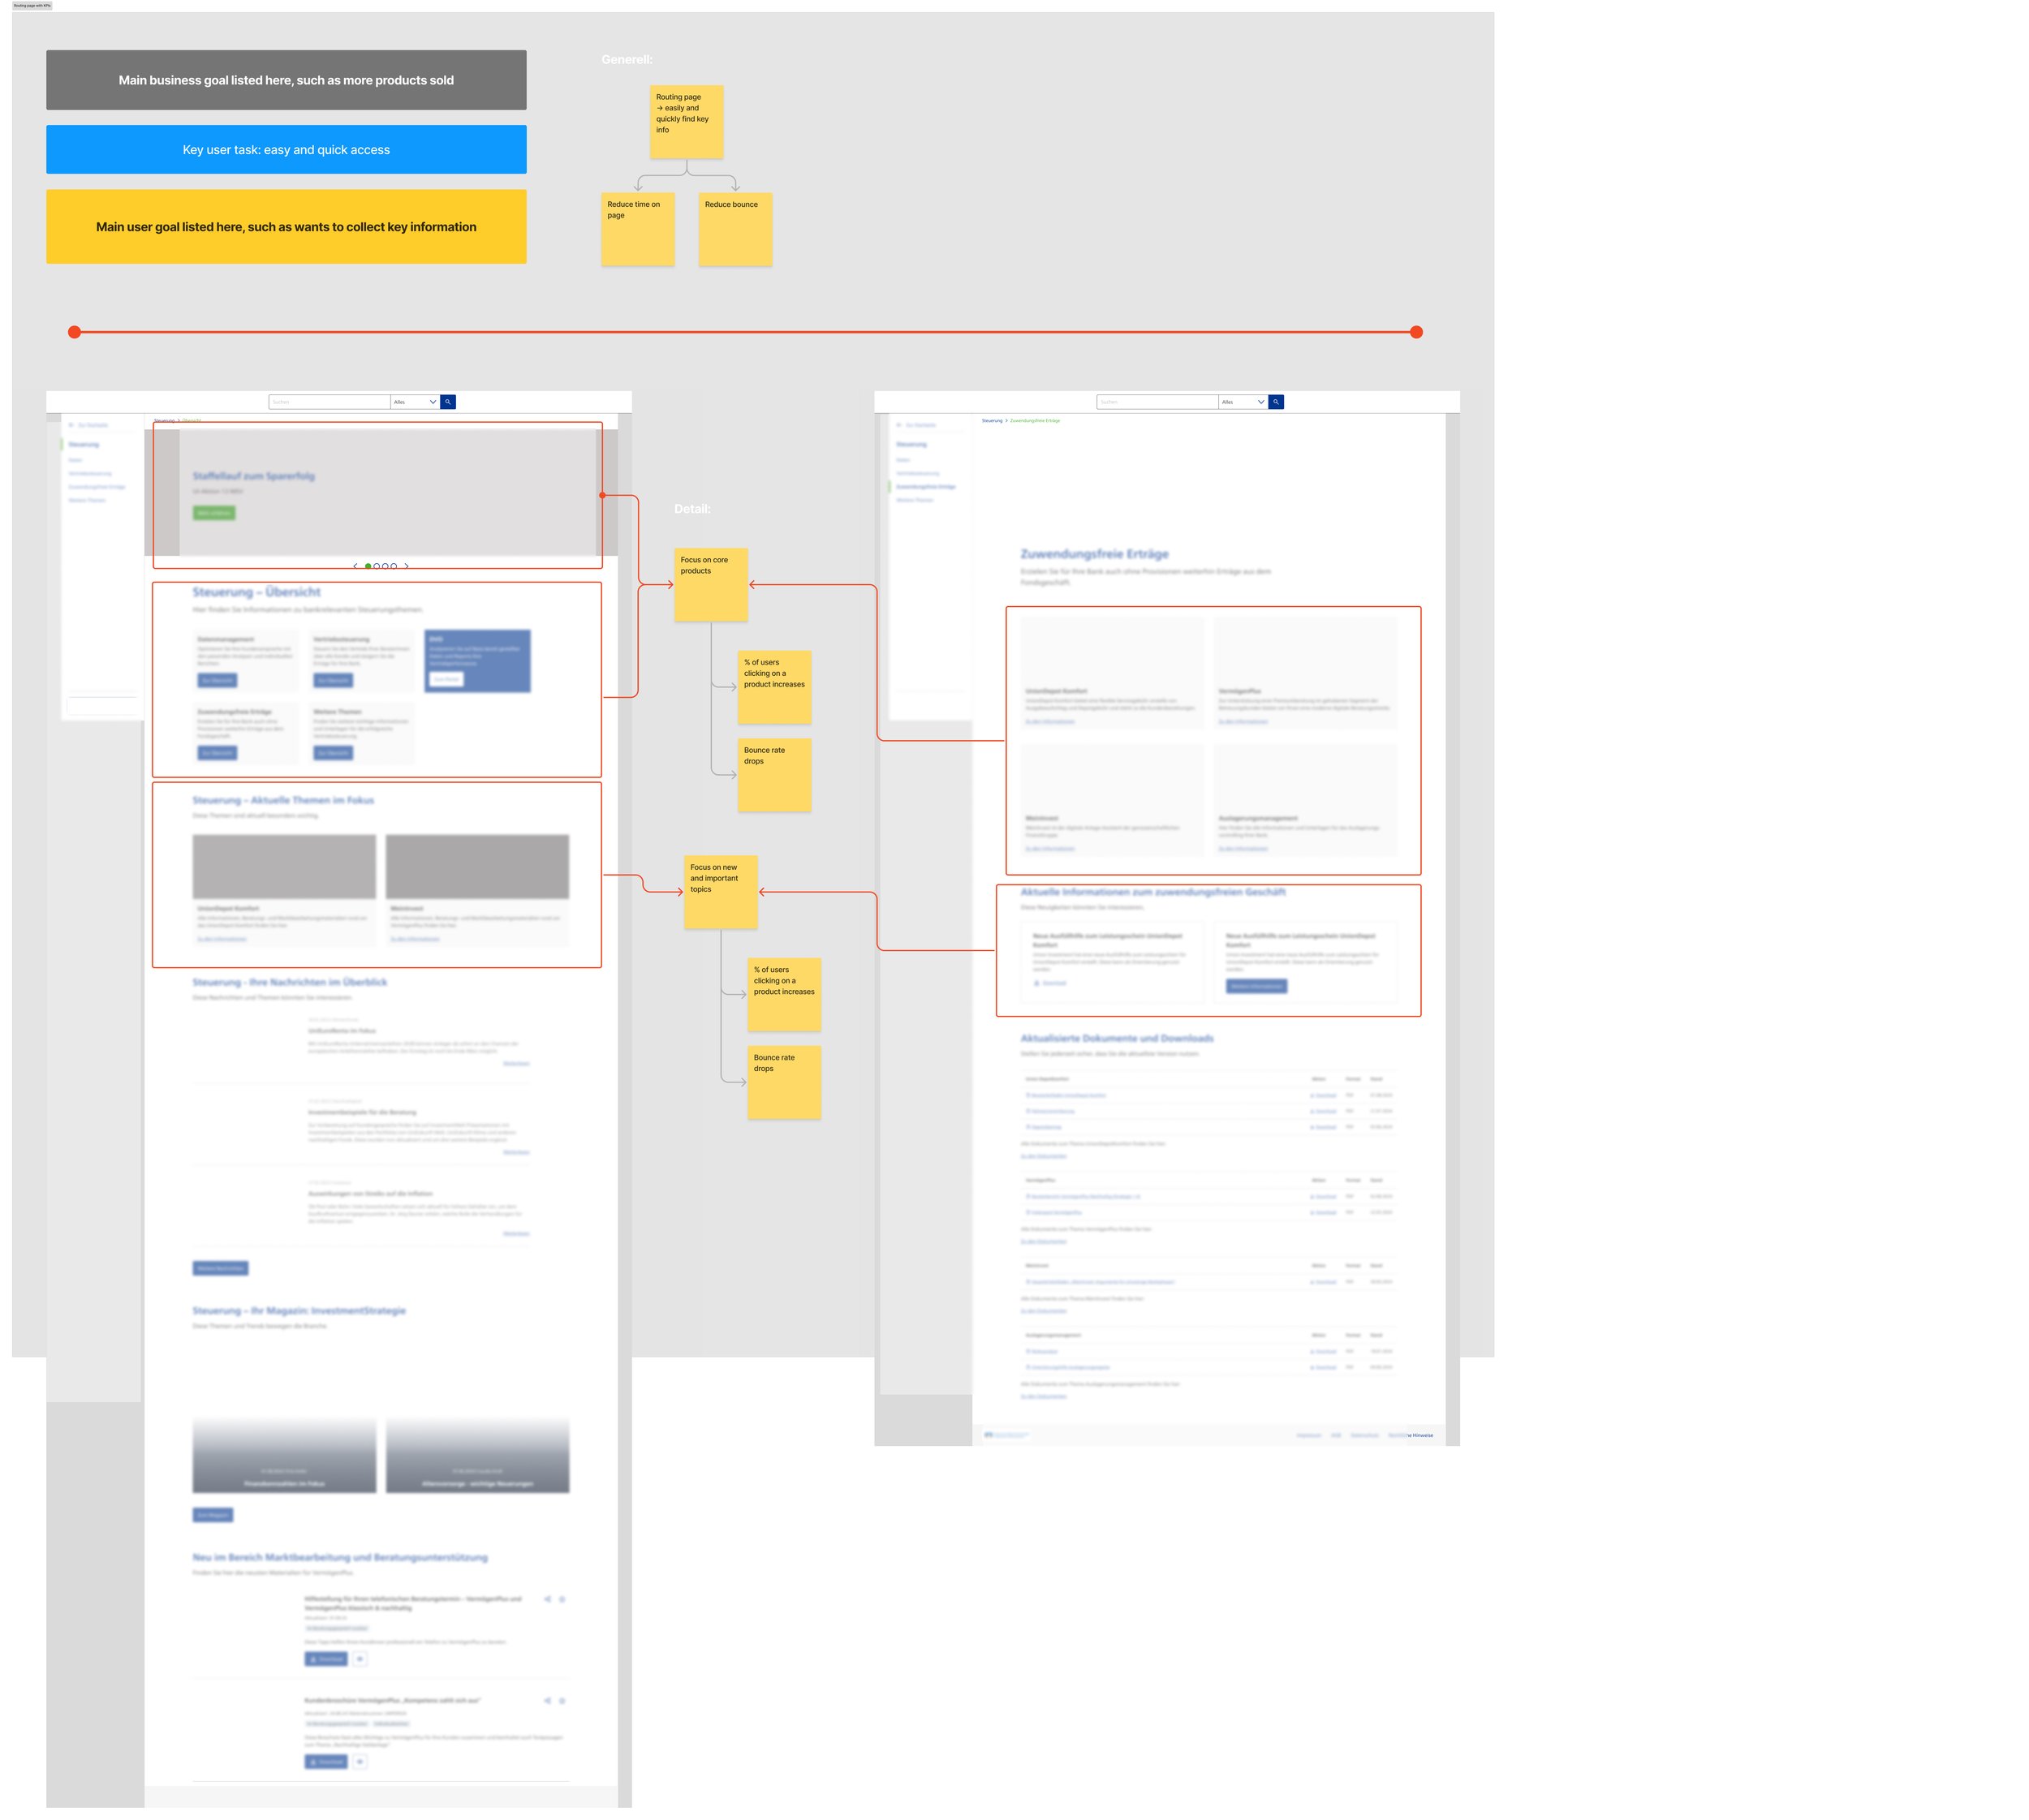
Design patterns mapped against Input Metrics to make sure each design and section is contributing to the overarching goal.
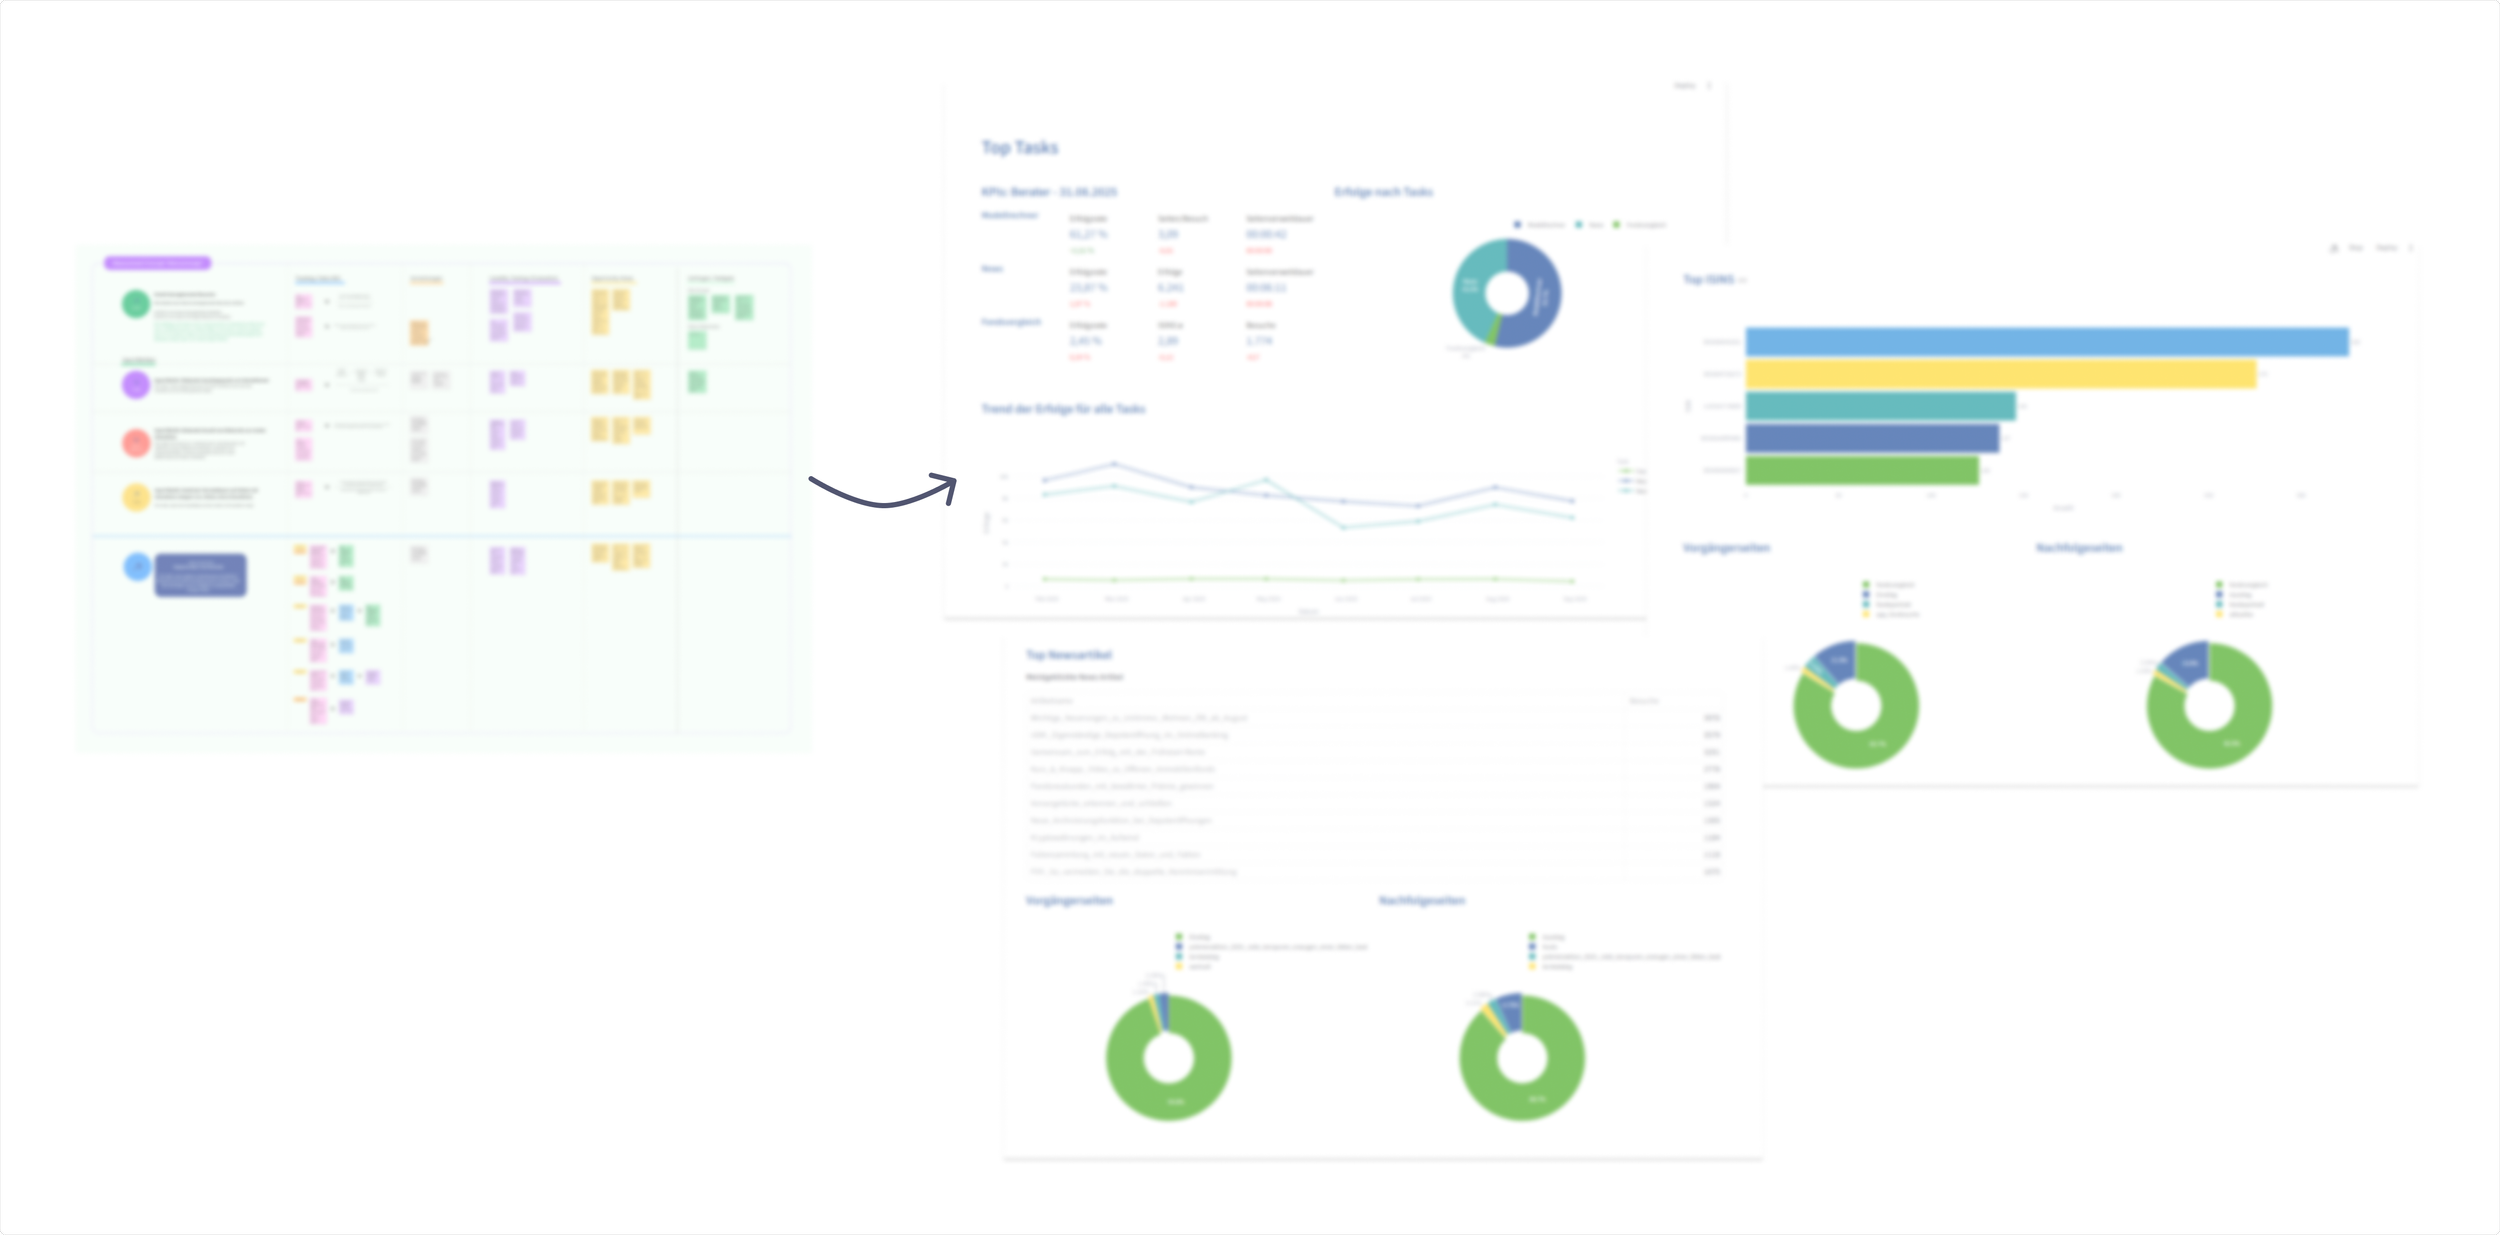
Dashboard indicating the performance of different parts of the product along the Input Metrics.
outcome and impact
Here’s an overview of what we’ve achieved in this project:
the framework gave teams a shared language and clear focus
roadmap discussions dropped by 50%
dashboards made design impact visible for all 8 teams
recurring design patterns were now measurable and standardised
teams shifted from feature delivery to outcome-driven thinking

key takeaways
Simplifying the framework early increased adoption. And starting small and rolling it out incrementally helps teams embrace a big, cross-team initiative without feeling overwhelmed.